Sometimes you want a piece that is just a single point—like a lonely dot in the middle of nowhere. Use the point syntax: (2, 3) with a condition. For example, y = {x = 2: 3} will plot just the point (2, 3).
What about closed vs. open circles at the boundaries? Desmos uses your inequality sign to decide. If you use <= or >=, the dot is filled (closed). If you use < or >, it’s an open circle. Physics teachers love this for showing "jump discontinuities." You’ll feel like a wizard.
Another side comment: Want to hide the open circle’s "hole"? You can’t really, but you can add a separate point manually using a table if you’re desperate. But honestly, embrace the holes—they make your graph look edgy and academic.
Real Talk: Why You’d Bother
Piecewise functions aren’t just for torturing students in precalculus. They model real-life stuff like tax brackets, shipping costs, or the exact moment your mood switches from "I’m fine" to "don’t talk to me." If you’re a data nerd, you can even use them to create custom animations or visual filters.
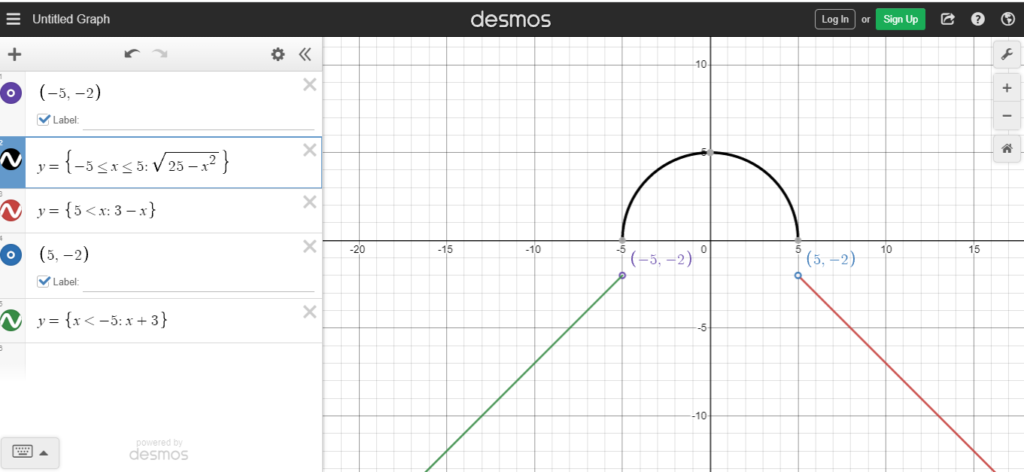 How to do piecewise functions on Desmos Graph Calculator?
One time, I used piecewise in Desmos to build a simple "traffic light" graph that turned red, yellow, and green based on a time slider. My friends thought I was a genius. I just knew how to type curly braces.
The main takeaway? Desmos treats piecewise functions as a single, chunky equation. You don’t need to define separate lines or use complicated logic. Just remember: {condition: expression, condition: expression}. It’s like talking to a very literal teenager.
Common Mistakes (That I Definitely Made)
First: forgetting to close all your curly braces. Desmos will highlight the error in red, but you’ll still panic. Second: using a regular equals sign = inside a condition instead of a double equals ==. Wait—actually, in Desmos, you can use a single = inside a condition for equality. Don’t overthink it.
Third: thinking you need to plot the pieces one at a time. No, no, no. Put it all in one expression line. Desmos is smart enough to hide the parts that don’t match the condition. You’re welcome.
Final side note: If you want to get fancy, you can use piecewise with parametric equations or even 3D graphs (Desmos 3D beta). But that’s a story for another day. For now, go forth and break your functions into pieces.
Now, go open Desmos. Type something weird. See what happens. You’ll either create math art or a complete disaster. Either way, you’ll learn something. And if you get stuck, blame the curly braces—I do.