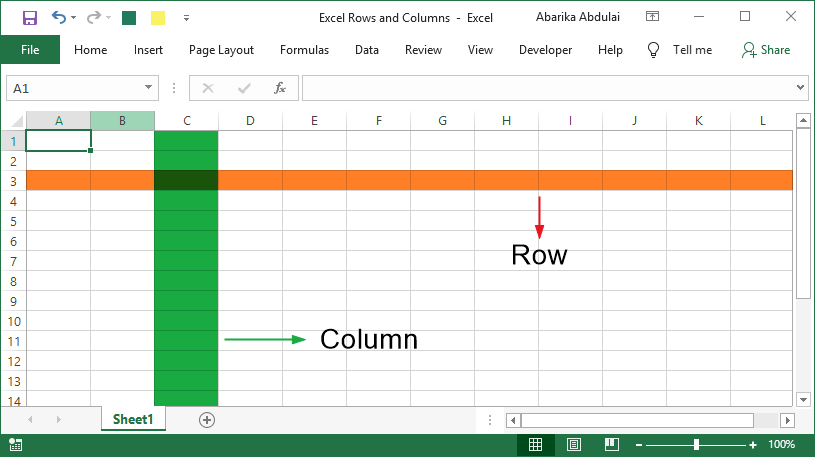
Think of a row as a horizontal line of stuff. It goes from left to right, like a lazy cat stretching across a couch. In a spreadsheet, each row is one complete record—like a single person’s name, age, and favorite pizza topping.
Picture a classroom of kids sitting in rows for a photo. Each row is a whole person, with a head, arms, and maybe a weird grin. If you mix up the rows, you get chaos—imagine putting Timmy’s legs on Sarah’s torso. That’s a spreadsheet nightmare.
Rows are also the backbone of tables. Whether it’s a seating chart, a grocery list, or your Netflix watch history, every horizontal slice is a row. They’re the “what” of the data—the actual story.
Columns: The Vertical Superheroes
Now flip your brain 90 degrees. A column is a vertical stack of stuff, going up and down like an elevator or your motivation after lunch. Columns hold categories—like “Name,” “Age,” or “Cuteness Level” (which should always be a column).
If rows are the people at a party, columns are the questions you ask them. “What’s your name?” (Column A). “What’s your sign?” (Column B). “Do you like pineapple on pizza?” (Column C). Don’t judge the last one; it’s a serious data point.
Columns make data searchable. Without columns, you’d be digging through a giant pile of facts like a raccoon in a trash can. With columns, you can instantly find “Age” and realize everyone in your friend group is now over 30. Ouch.