Honestly, piecewise functions aren’t just math homework torture. They model real life. Think about a taxi meter that charges a flat fee for the first mile, then a different rate after that. That’s a piecewise function! Your phone bill, income taxes, even the speed of a car that accelerates and then cruises – it’s all piecewise.
Desmos makes you feel like a wizard because you can see these messy real-world rules turn into a single, smooth graph. You’re not just doing math; you’re telling a story with numbers and dividing it into chapters.
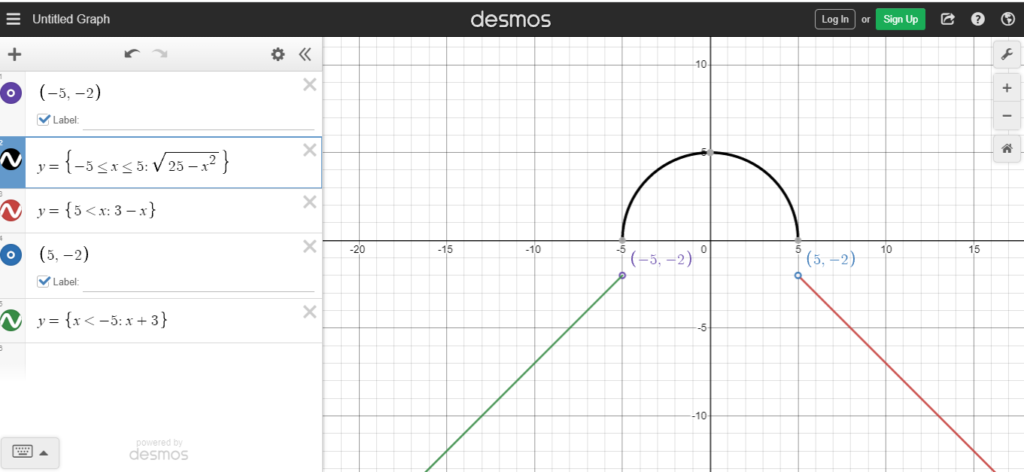 How to do piecewise functions on Desmos Graph Calculator?
The trick you need to know
Here’s the chill pro tip: use parentheses for conditions that include the boundary. If you want a solid dot or an open circle? Desmos handles that automatically if you use close (like x ≤ 0) or open (like x < 0) inequalities. Just be careful with your signs – a tiny typo can send your graph to Narnia.
Also, you can make the graph look even cooler by graphing two different equations as separate pieces. For a truly wild ride, try y = {x < 0: x^2, x > 0: -x^2}. Watch that parabola flip upside-down mid-air. It’s like a graph doing a backflip.
What about three pieces? Go for it. Just keep adding commas: y = {x < -1: 1, -1 <= x < 1: x, x >= 1: 1}. This creates a flat line on the sides, and a slanted line in the middle. It’s like a graph wearing a little hat.
Not sure if your function is working? Desmos will show you a hint in red if you mess up. Don’t panic. Usually, it’s just a missing parenthesis or a comma in the wrong spot. Breathe, fix it, and watch the graph appear.
And here’s the secret most tutorials won’t tell you: you can use piecewise functions to mask parts of a graph. Want only the positive part of a sine wave? y = {x > 0: sin(x)}. Boom. You just became a digital sculptor.
So next time you’re messing around in Desmos, try giving your graphs a secret second life. It’s like being a director who tells the actors exactly when to come on stage. Piecewise functions let you control the show, one condition at a time.
What will you make? A bridge? A heartbeat? A graph that looks like a mountain range? The only limit is your tolerance for typing curly brackets. Go ahead, give it a shot. You might just find that math gets way more interesting when you let it change its mind.